NOW YOU SEE IT:
DASHBOARD MAGIC WITH
DYNAMIC ZONE VISIBILITY IN TABLEAU
March 17, 2026 - 8:00pm GMT / 4pm EDT
FREE LIVE WEBINAR
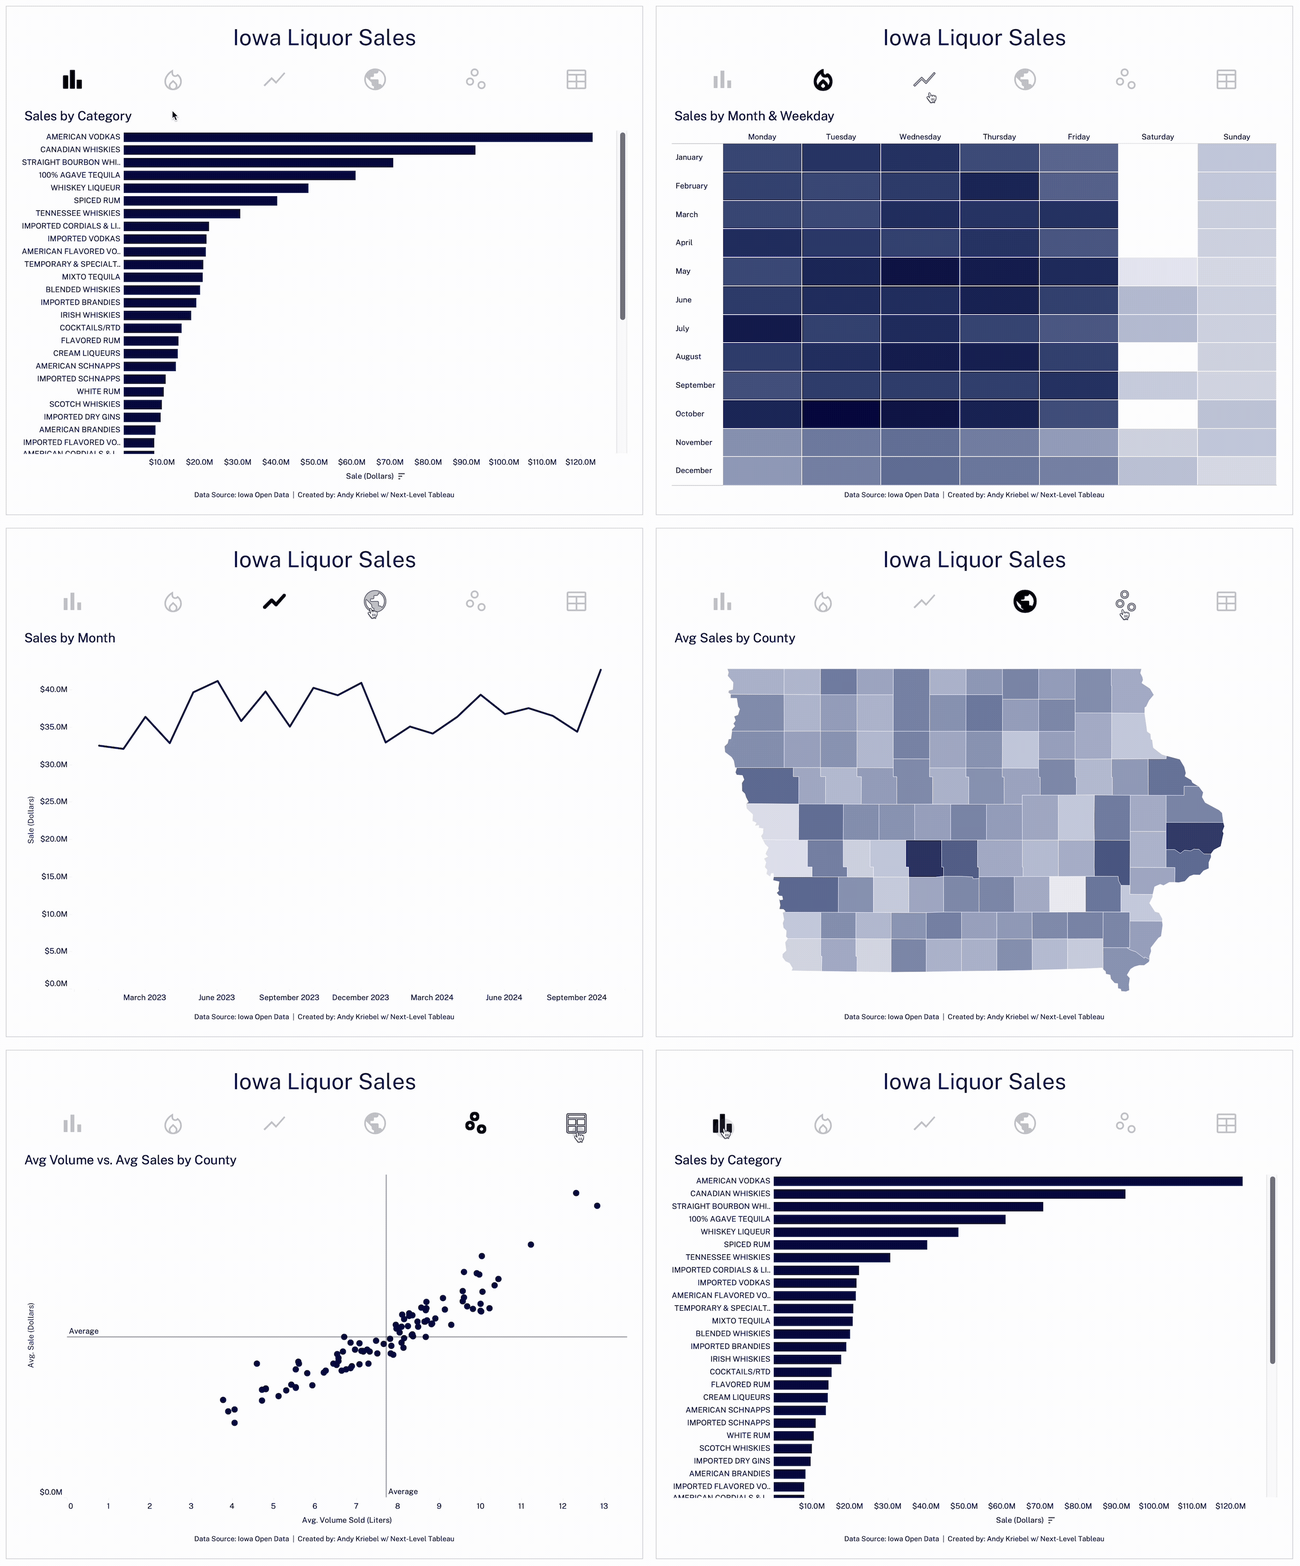
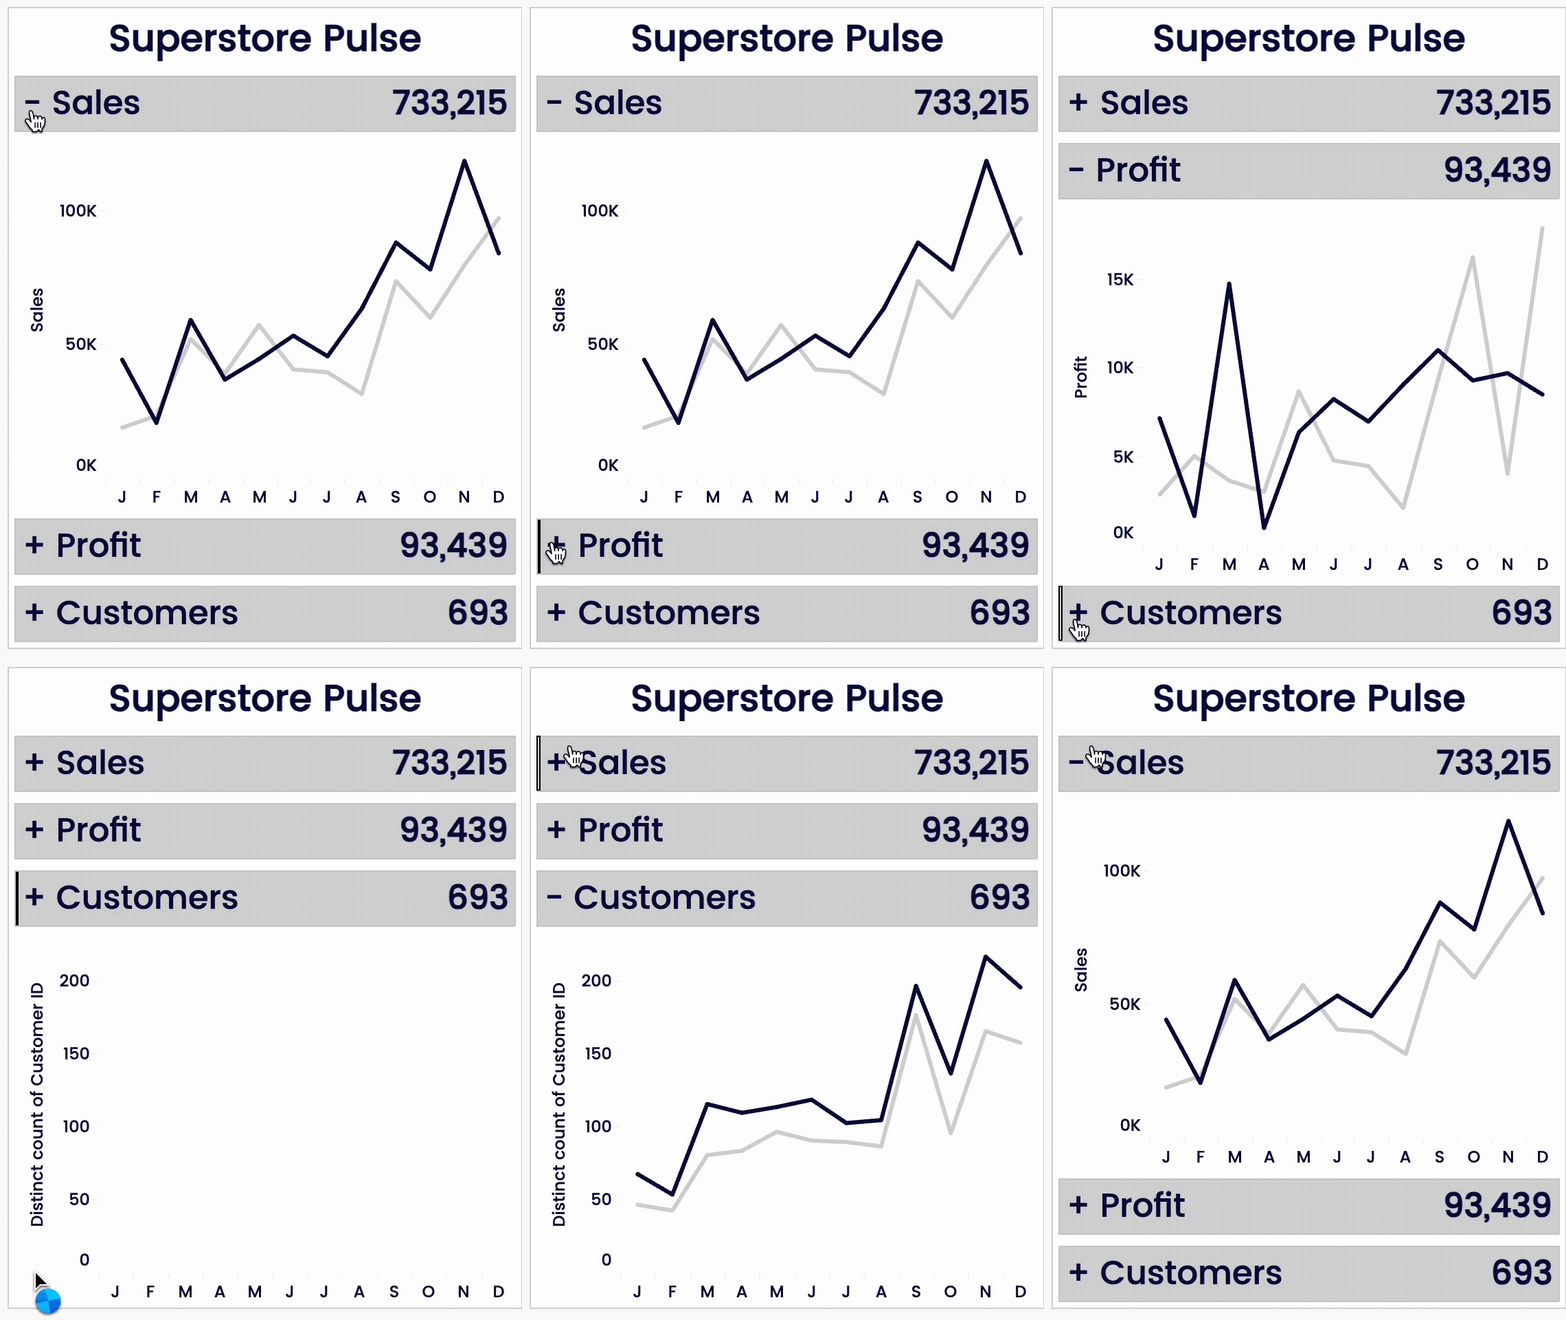
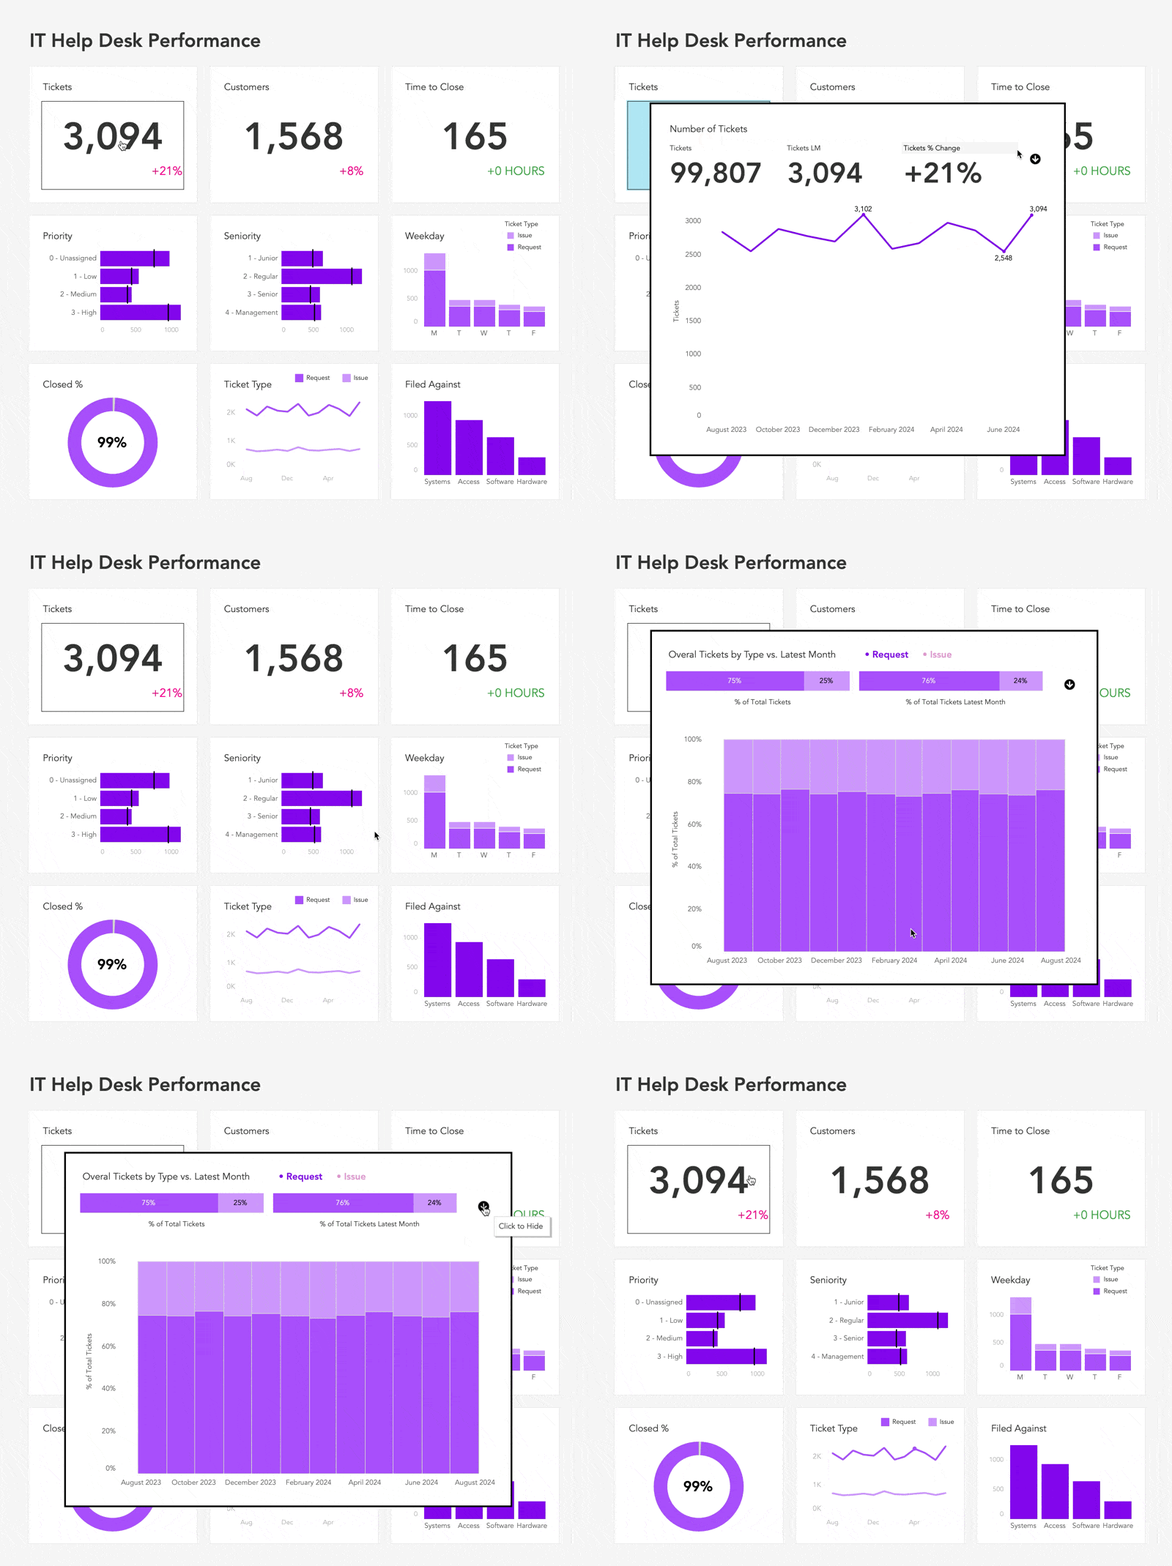
Learn how to hide what’s not needed, reveal what matters, and create dashboards that drive better decisions.
by Tableau Visionary Andy Kriebel
Here's what's waiting for you when you join us live...
1
LEARN
how to control exactly what users see and when they see it
2
CREATE
clean, interactive dashboards that switch between views instantly
3
IMPRESS
your stakeholders so you become their go-to person

HEY ANALYSTS
STOP STRUGGLING
with cluttered, complicated that are too hard to navigate.
START USING DYNAMIC ZONE VISIBILITY
to keep users focused on real insights at the right time.
IF YOU’VE EVER:
felt like your dashboards could be doing more
watched your stakeholders squinting at the screen, trying to make sense of all the data
or been asked to “just give it to me in Excel”
….it’s time to stop guessing and start building with confidence.
In this free, live masterclass, Andy Kriebel—Tableau Visionary and dashboard expert—will break down how to use Dynamic Zone Visibility the right way, so your dashboards become cleaner, more interactive, and deliver insights your stakeholders will love
In just 60 minutes,
YOU’LL LEARN HOW TO:
-

Configure DZV the right way every time (without guesswork)
-

Build interactivity that helps your users make decisions
-

Design dashboards that reveal insights with just a click
-

Combine DZV like a pro (and know when to keep it simple)

So you can build better dashboards, master Tableau, and advance your career.
HOW THIS TRAINING WILL HELP YOU
Most analysts never fully master Dynamic Zone Visibility—and it shows. This isn’t just a lesson on “adding interactivity.” It’s a deep dive into building visualizations that:
Earn instant buy-in from stakeholders
Feel polished and dynamic at first glance
Make you look like the strategic thinker you are
Walk away with techniques you can apply immediately (and keep using to elevate every dashboard you build)
Praise for
NEXT-LEVEL TABLEAU
“For me, the trick to getting out of the rut was signing up for Next Level Tableau! Getting to the next level required one-on-one time with the best in the business.”
Jarod Vierstra | Tableau Consultant at Chart My Data
“Before Next-Level Tableau, I struggled with data visualization and often felt uncertain about my skills and approach.
Now, my approach has completely changed—I now fully understand basic and complex Tableau concepts.”
Mayokun Akeremale | Information Specialist at FAO
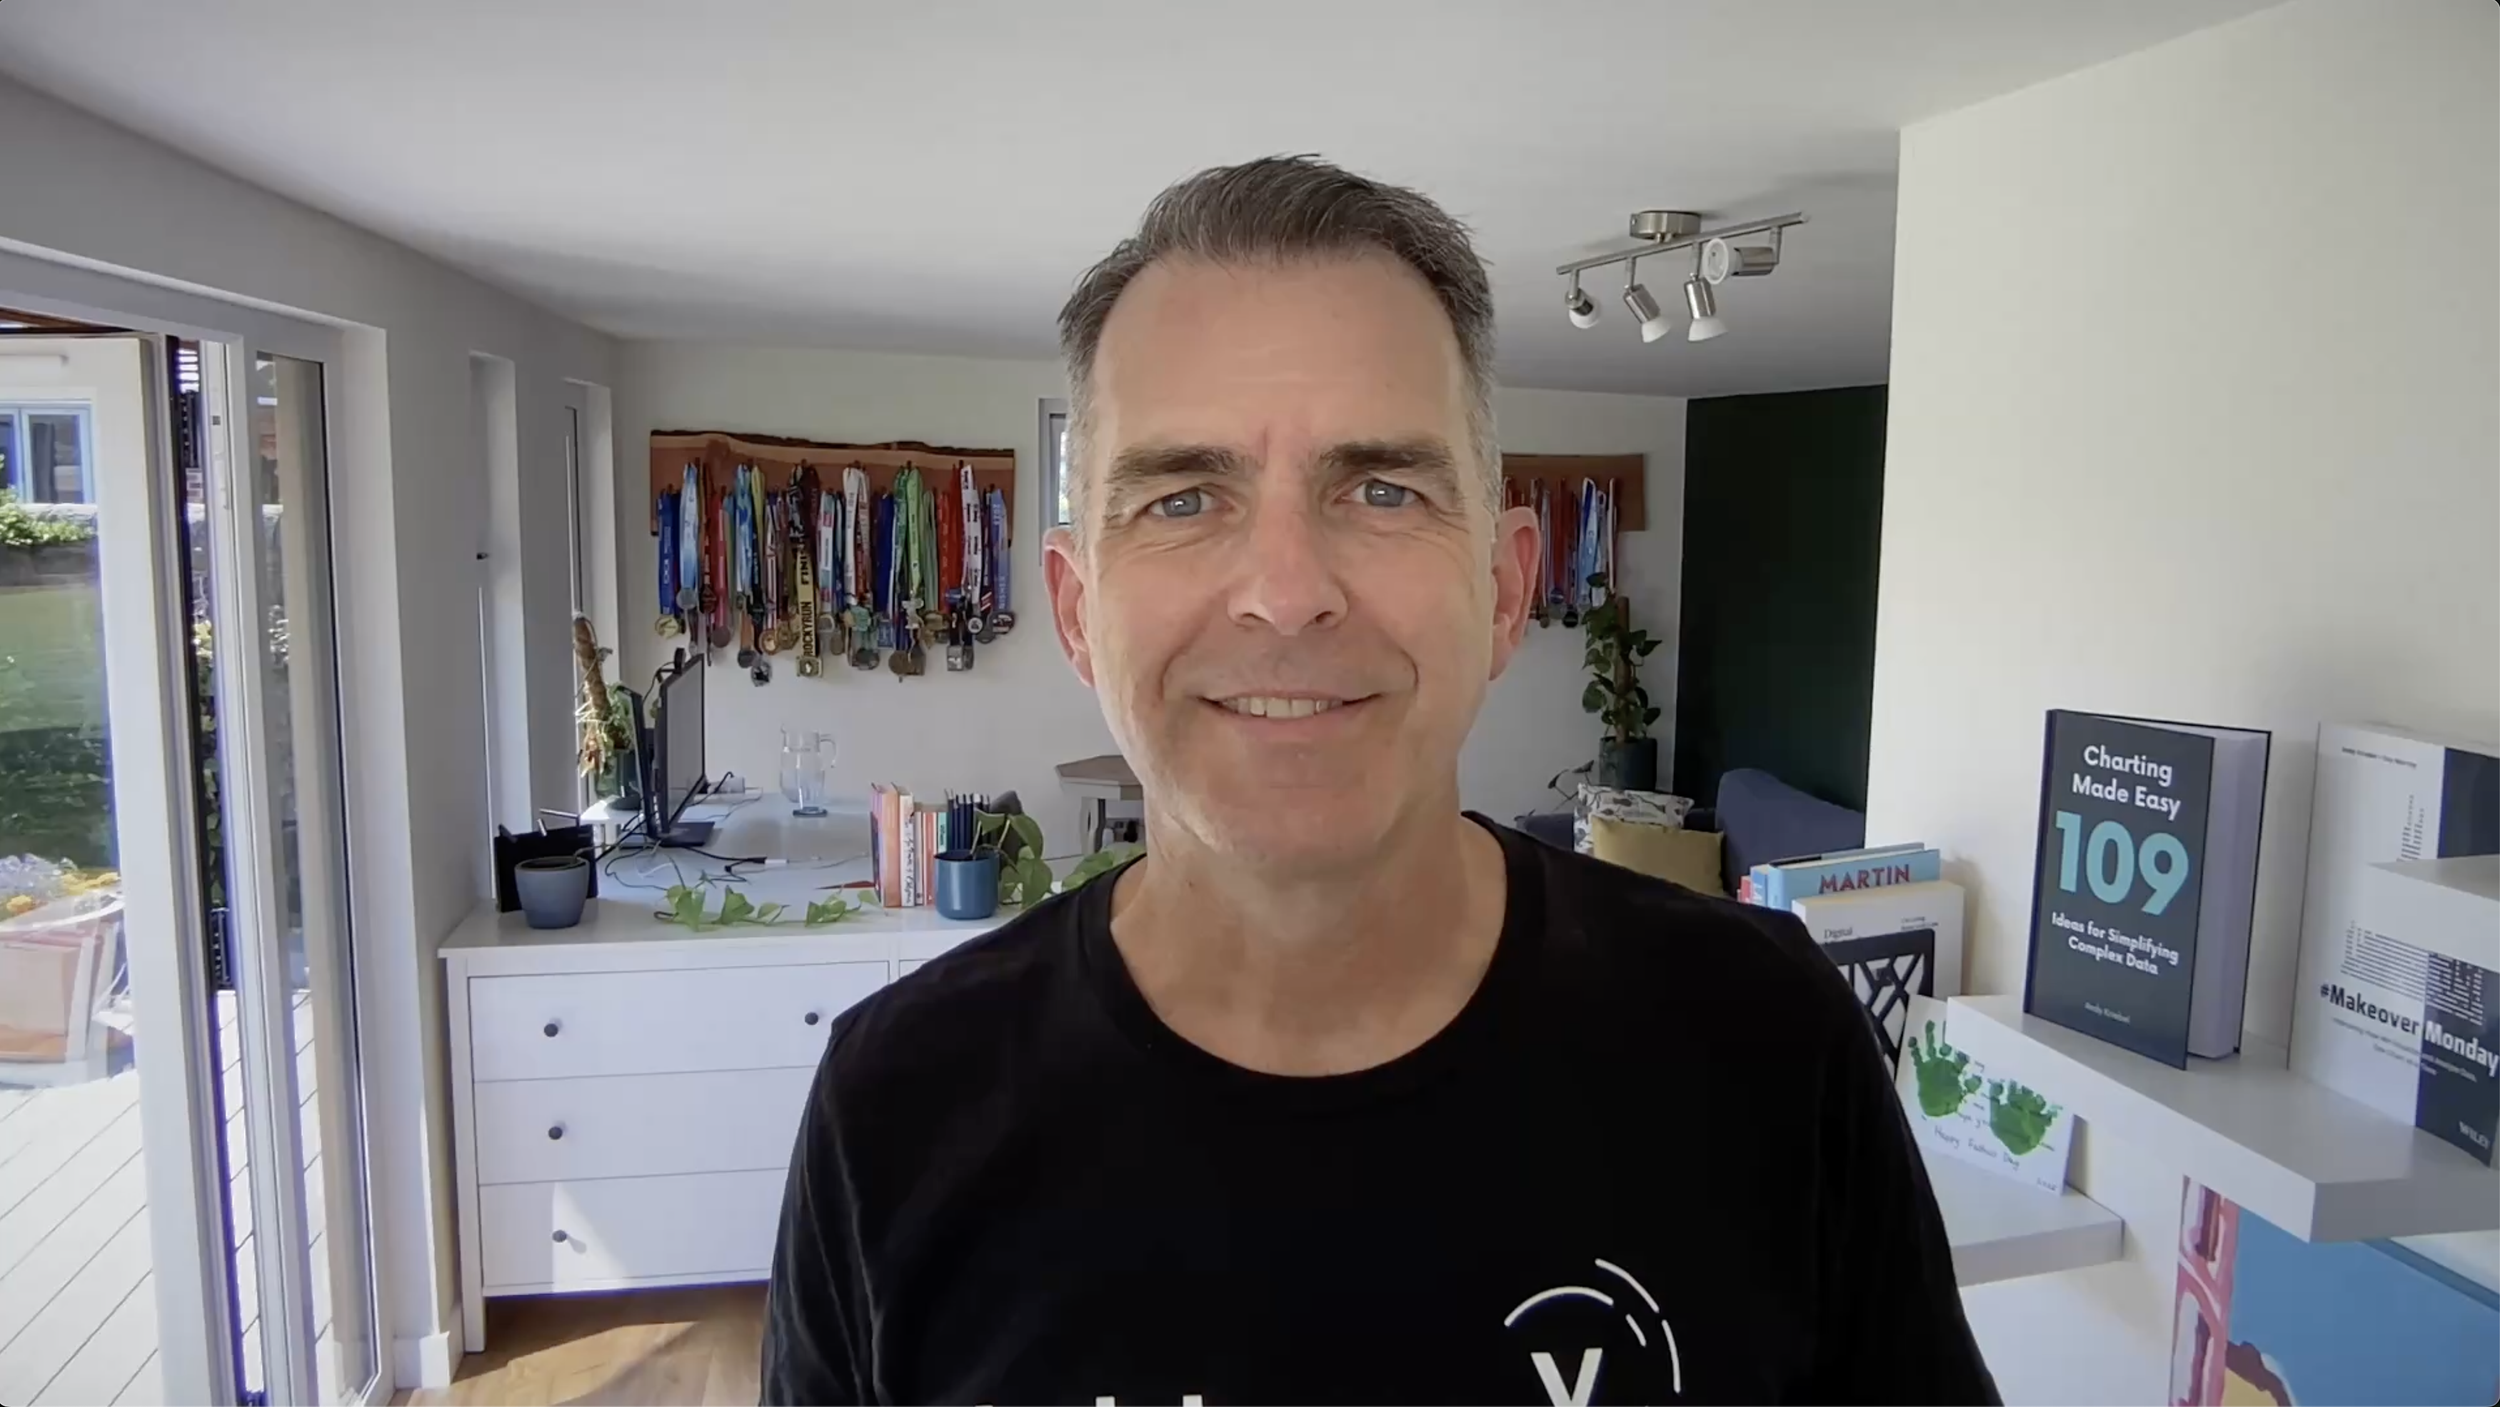
IF YOU DON’T KNOW ME YET…
I’M ANDY KRIEBEL
Tableau Visionary Hall of Fame member
Also known as VizWiz, the Tableau Guy, a Tableau Visionary and most recently, Data IQ’s top 100 most influential people. Go me.
But 18 years ago when Coca-Cola tasked me to build a dashboard – I thought they were talking about a car.
I found Tableau and had the entire project done in 30 minutes. And from that moment, I was hooked.
I’ve spent almost two decades turning data into impact – mastering Tableau and helping thousands of analysts do the same.
THIS IS FOR YOU IF:
You’re a beginner or intermediate Tableau user who wants create engaging, interactive dashboards
You’re an advanced Tableau analyst who’s frustrated by complicated dashboards and containers that are making your dashboards slow (and wants clarity and control)
You’re a developer tired of dashboards that break, confuse users, or fail to drive insights
STOP GUESSING
START BUILDING WITH CONFIDENCE.
Your dashboards—and your career—deserve better visualizations.
March 17, 2026 - 8:00pm GMT / 4pm EDT
FREQUENTLY ASKED QUESTIONS
-
The masterclass will be recorded and everyone who registers will get access. You can register here.
-
This masterclass is for anyone who creates dashboards in Tableau. You'll walk away understanding the most critical concepts when working with Dynamic Zone Visibility to add interactivity to your dashboards.
-
You will receive all materials used during the masterclass. In addition, after the class you will be sent a link to the recording, presentation, and the final workbook with the solutions.
-
Block time in your calendar, be ready with the workbook open, have a drink and snacks with you. This requires intense focus for 60 minutes.
-
Often, these classes have a lot of attendees, so it's impossible to answer every single question. Drop your questions in the chat and we’ll do our best to answer them.
-
Publish the dashboard we create to your Tableau Public account. Then write a LinkedIn post about what you learned with an image and a link to your dashboard. Don't forget to tag Andy on your post.


